Research outline
It is pointed out that the suspended particle matter (SPM or PM) in the atmosphere, that is "aerosol," not only has a harmful influence on human health and vegetation but also leads climate change. When aerosol particles are emitted into the atmosphere, they influence the radiation budget of the earth's atmosphere through two effects. One is the aerosol-radiation interaction (direct effect) in which they scatter and absorb the solar and thermal radiation. The other is the aerosol-cloud interaction (indirect effect) in which they alter microphysical and optical properties of cloud droplets acting as cloud condensation nuclei. It is therefore expected that anthropogenic aerosols can be substances causing climate change, which is, however, not known more than the global warming by anthropogenic greenhouse gases in the public. In 2001, the Intergovernmental Panel on Climate Change (IPCC) published the evaluation of the anthropogenic aerosol radiative forcing referring to past modeling studies, but its confidence level is still lower than those of greenhouse gases and ozone. This is because global aerosol distributions and radiative properties are not clearly understood because of complex characteristics of aerosol particles such as various origins, short lifetime of several days, complex chemical compounds, and various size distributions.
Therefore we have developed a global three-dimensional aerosol model, SPRINTARS, based on the general circulation model (GCM) of Atmosphere and Ocean Research Institute (AORI), University of Tokyo/National Institute for Environmental Studies (NIES)/Japan Agency for Marine-Earth Science and Technology. The model treats all of the main tropospheric aerosols, i.e., carbonaceous (black and organic carbons), sulfate, soil dust, and sea salt, and calculates a series of transport processes of emission, advection, diffusion, chemical reaction, and deposition (wet deposition, dry deposition, and gravitational settling). It is coupled to the radiative process in the AGCM for evaluating the radiative forcing. It also includes changes in cloud droplet radius and precipitation depending on aerosols for the indirect effect. The detail of the model is described by Takemura et al. (2000, 2002, 2005, 2009).
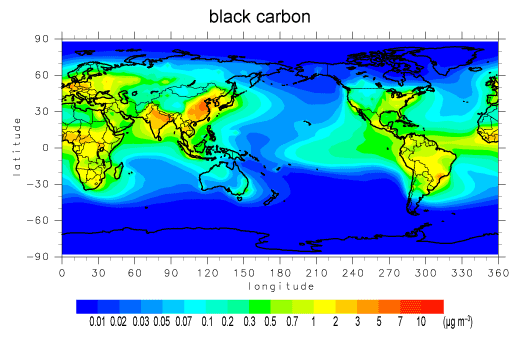
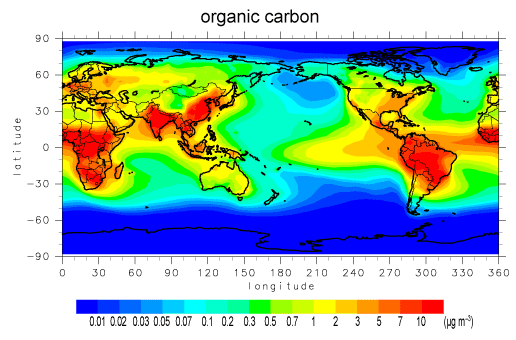
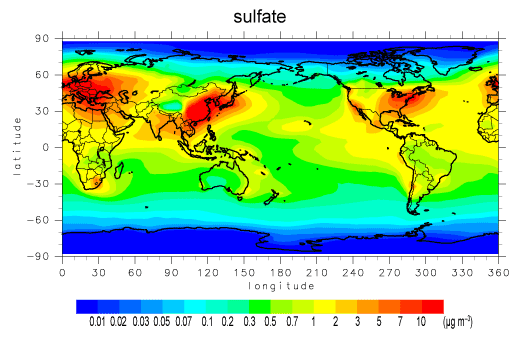
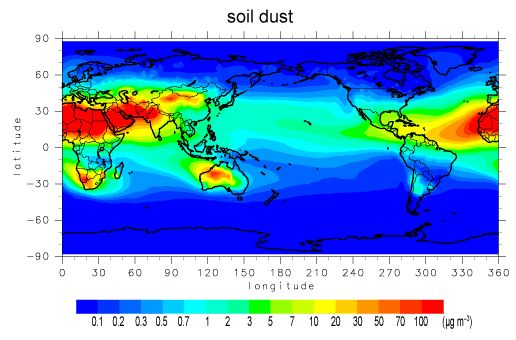
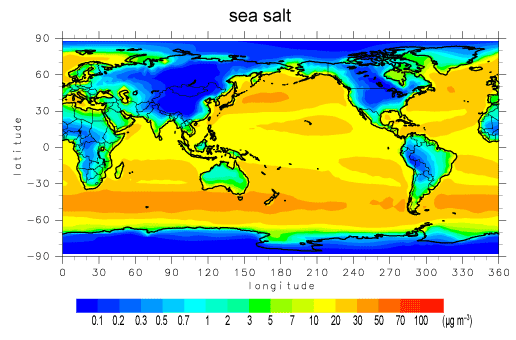
Figure 1 shows the annual mean distributions of surface mass concentration of each aerosol component. Saharan dust particles are transported to the sub-tropical Atlantic by the trade wind through the year. Large amount of soil dust is also seen in the Arabian region, especially in the Northern Hemisphere summer, which is emitted and transported by monsoon wind. Carbonaceous aerosols originating from biomass burning are prominent in the central and southern Africa, South America, and Southeast Asia in each dry season. They are also emitted and transported from industrial regions with consumption of fossil fuel and domestic fuels through the year mainly in Asia, North America, and Europe. A high concentration of sulfate aerosols originating from anthropogenic sources is seen mainly in mid-latitudes of the Northern Hemisphere. The maximum sea salt concentration is over the Antarctic Sea at 50-60S through the year. These simulated aerosol distributions are in reasonable agreement with satellite, ground-based, and aircraft observations.
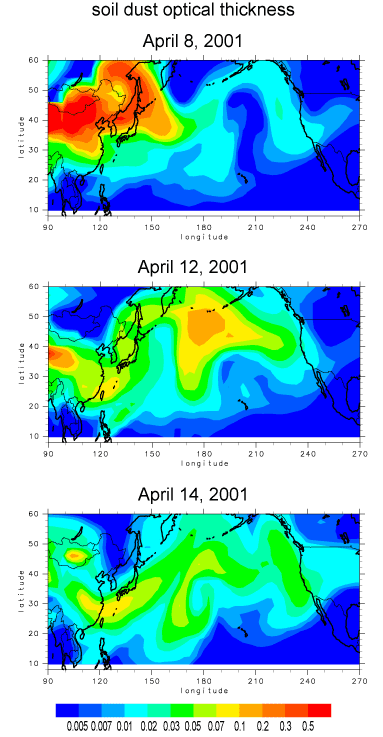
SPRINTARS also successfully simulates short-term and regional aerosol transport. For example, Figure 2 shows the daily mean distributions of the dust optical thickness during the large-scale Asian dust storm in April 2001. A large amount of dust intermittently emitted in the atmosphere by a developing cyclone around Gobi Desert between 6 and 9 April, and then transported eastward with post-frontal outflow passing the northern Chinese coastal region, Korea, and Japan. It reached North America about one week later from the emission crossing the North Pacific Ocean. These spatial and temporal patterns of the dust air mass are similar to the satellite observation.
Figure 2: Daily mean distributions of the optical thickness for soil dust on 8, 12, and 14 April 2001.
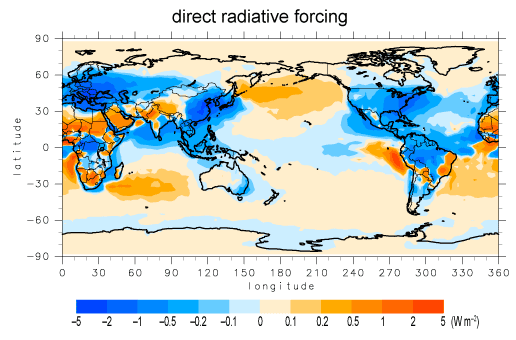
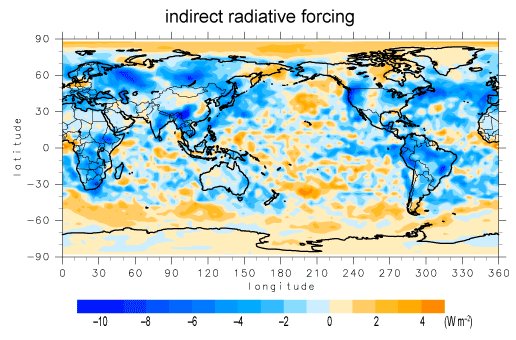
Figure 3 shows the annual mean radiative forcing for the aerosol-radiation and aerosol-cloud interactions of anthropogenic aerosols at the top of the atmosphere. The positive radiative forcing means warming the atmosphere and negative means cooling (that of anthropogenic greenhouse gases is estimated to be +2.43 W m-2 in IPCC). The radiative forcing for the aerosol-radiation interaction is calculated to be negative especially around industrial and biomass burning regions. Positive direct forcing is, on the other hand, found over the outflow regions of black carbon originating from biomass burning and industrial sources. The large negative radiative forcing for the aerosol-cloud interaction is seen over the northwestern Pacific, Southeast Asia, Eurasia, North America, South America, and southern Africa. The global mean radiative forcings of the aerosol-radiation and aerosol-cloud interactions by anthropogenic aerosols are estimated to be -0.1 and -0.9 W m-2, respectively.
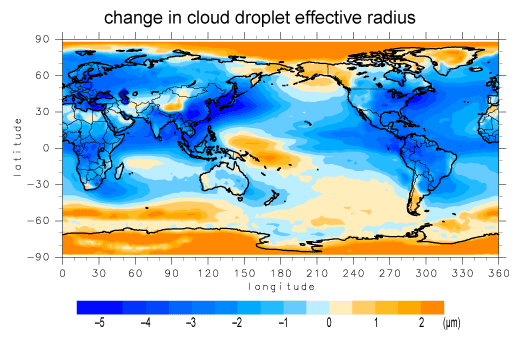
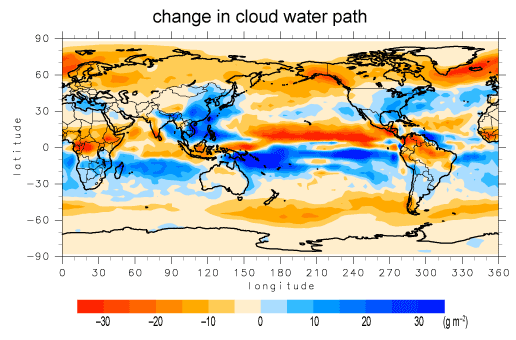
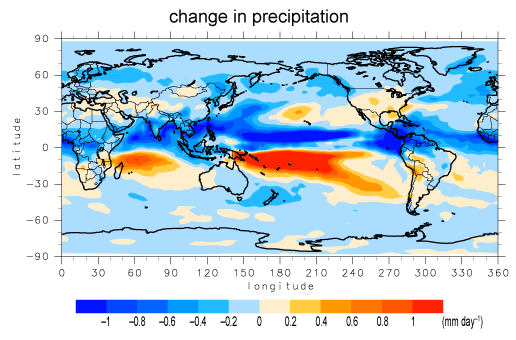
Figure 4 illustrates changes in the cloud droplet effective radius at the cloud top above 273K, cloud water path, and precipitation by the anthropogenic aerosol effects simulated with the mixed layer ocean model. The cloud droplet radius, which is related to the first indirect effect, decreases almost all over the globe, especially over east and south Asia, Europe, North America, central and southern Africa, and South America. An increase in cloud water results in an increase in precipitation over a large part of the globe, and vice versa, especially in tropical regions, because of a change in the hydrological cycle caused by temperature decrease due to the aerosol direct and first indirect effects. In east and Southeast Asia and the Atlantic in the tropics and mid-latitude of the Northern Hemisphere where a large amount of anthropogenic aerosols and cloud water exist, on the other hand, an increase in the cloud water and a decrease in precipitation simultaneously occur, that is a strong signal of the aerosol second indirect effect rather than the change in the hydrological cycle.
We have to continue studies of the aerosol effects on climate in order to reduce the uncertainty of estimating the climate change.